SpectrumEffect
Source:
SpectrumEffect.h
SpectrumEffect
src/light/effects/SpectrumEffect.h:25Inherits:
EffectBase
Audio effect: a spectrum analyzer with asymmetric ballistics and falling peak dots.
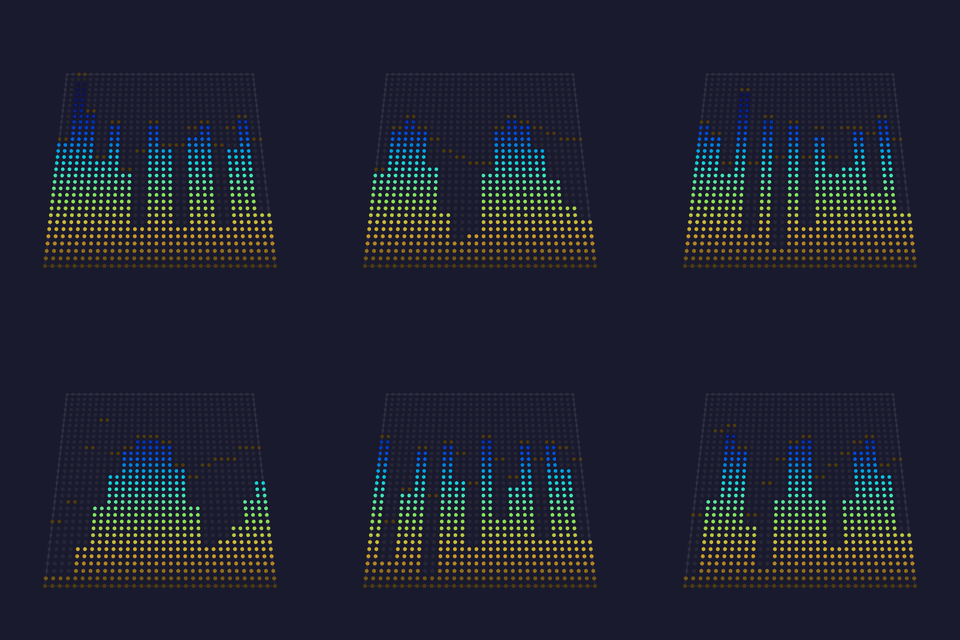
Two behaviors are what make a meter read as an instrument rather than a bar chart. A bar rises fast enough to catch a transient and falls slowly enough to be readable. A dot then marks the highest recent level and drifts down, showing what has passed.
Prior art: the standard VU and PPM meter ballistics, and WLED's GEQ for the band mapping.
Public Attributes
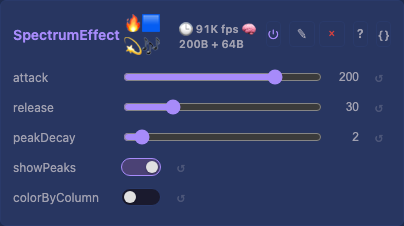
uint8_t attack = 200
: How fast a bar rises toward a new level, where 255 is instant.
uint8_t release = 30
: How fast it falls back, which is deliberately slower.
uint8_t peakDecay = 2
: How fast the peak dot drifts down.
bool showPeaks = true
: Draw the held peak above each bar.
bool colorByColumn = false
: Color each bar by its column rather than by height.
Public Methods
virtual inline const char * tags() const override
: Catalog tags: a showcase, and audio-reactive.
virtual inline Dim dimensions() const override
: Writes the z=0 slice, which extrude fills through a volume.
virtual inline void defineControls() override
: Publish the ballistics, the peak's decay and the coloring.
virtual inline void prepare() override
: Size one follower and one peak per column.
virtual inline void tick() override
: Follow each band with its own ballistics, then draw its bar and peak.
More info
The ballistics live in the toolbox
smoothFollow and peakHold are shared, so any effect wanting a meter gets the same feel. GEQEffect hand-rolls its own peak tracker into a buffer sized to the column count instead. [draw::bar] draws the columns too, so this effect owns no drawing loop. What remains is the band-to-column mapping and the choice of colors, which is its own.